Thursday, November 9, 2017

International Economics Part 1 - Reasons to trade?

This series will focus on international economics. Today we will discuss the positive implications of international trade. Lets go baby!!!

1. Greater Choice - Eating fruits and vegetables off-season is a prime example of this. People not only have an access to the domestically produced goods and services, but also products from a number of different countries.

2. Lower prices - International trade gives consumers the opportunity to purchase goods and sevices at a cheaper price as they are able to buy their demanded goods and services from other countries. Producers also gain from international trade, since they can purchase raw materials and other goods from other countries at a cheaper rate. The reason why this is possible is because some countries have more access to natural resources, have better technologies or different quality of labour forces. This means that more raw materials and goods are available, which can be sold at a lower price.

3. Economies of scale - when firms operate on an international market as well as on the domestic one, they are gaining size and therefore will increase the demand. As firms get bigger they can exploit economies of sclae, which will reduce their average costs.

4. Differences in resources - Some countries have different resources than others. When a resource is not available, but a firm needs it to produce a certain product, they can import the resource from different countries. Without international trade this would not be possible and countries with limited amount of resources would not be able to develop.

5. More competition - Because of international trade, domestic producers compete with foreign firms. This results in more efficiency and a reduction in prices. Therefore, consumers will have more options and more qualitative products to choose from.

6. Better allocation of resources - If firms can compete freely without government intervention then countries that are best at producing certain goods and services will produce them. These goods and services will be produced at the lowest cost and the efficiency will be maximized.  Theoretically, if this happens in every country in the world, resources will be allocated most efficiently.


Friday, October 27, 2017

Inequality

One of the biggest problems in todays world is the widening poverty gap between developed and less developed countries.

One of the main economics objectives is to achieve equity, which means fairness or evenness. It is difficult to define and measure. Hence, it is seen as a normative concept. Many economist relate equity to how fairly income and opportunity are distributed between different groups in a society.

Inequality of opportunity:

This occurs when people cannot access employment or institutions. These people cannot benefit from living as much as others in a market economy. 
Example: some children cannot access education, which leats to lower income in the future and lower living standards.

Inequality of outcome:

This happens when some people gain more than others from a transaction. 

Measure of inequality:

Inequlity can be measured by analyzing income distribution. Income distribution can be visualized by looking at a Lorenz curve.


The Lorenz curve shows % of income earned by a given % of population. Perfect income distribution would occur when each % of the population would get the same % of income. For example, Where 75% of the population get 75% of the national income. On the diagram above, income is not equally distributed. 75% of the population only gain 35% of the national income.

Gini coefficient:

This is a mathematical tool, which is used to compare income distributions between different countries. The range is from 0 to 1. The closer the coefficient is to 1 the greater the inequality


Thursday, October 5, 2017

Balance of Payments: Introduction

Balance of payments shows the countries transactions with the rest of the world. The inflows and outflows of this are catagorized into different sections:
  1. Current account(CA) balance of payments
  2. Fiscal account (capital) balance of payments

Balance of payment problems

Trading goods and services forms the largest part of countries current account. It also includes primary (refering to international payments of factors of production i.e. investment income and compensation to employees) and secondary income(refering to transfer payments flowing between countries i.e pension payments and oversea aids) flows. 

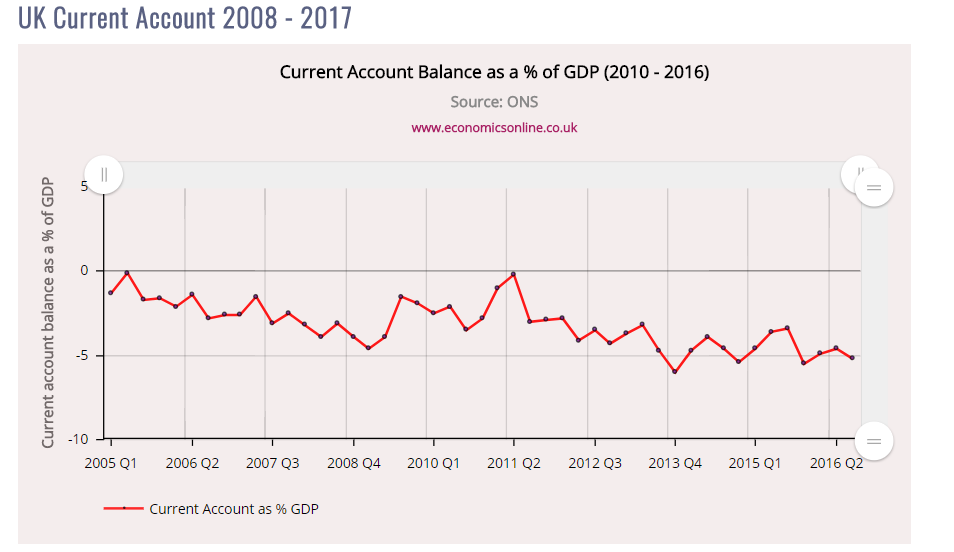
Example of UK's current account balance:


The trade balance is a part of the current account and refers to trades in goods and services between the country and the world. UK's trade balance example:


The current account defecit can be a problem when:

  1. There are no compensating inflows of investment income or inward capital account flows.
  2. The economy has a poor record of repaying debt.
  3. It is a persistent deficit that does not self-correct over time.
  4. The deficit forms a large share of GDP.
  5. The central bank has low reserves.


Saturday, September 16, 2017

 Deflation
Deflation is defined as the reduction in the general price level of an economy. 

Problems resulting from deflation;
  • Consumers might delay consumption. This is because consumers will try to save their money until prices drop even further so they can purchase their desired good more cheaply. This will have a negative impact on aggregate demand, incomes and output
  • Recession can occur due to reductions in consumer and business confidence. Consumers and businesses will rather save than spend. A recession caused by deflation is difficult to solve, since there will be a deflationary spiral in the economy.
  • Increase in real interest rates, since nominal interest rates cannot fall below 0. If nominal interest rates are 5% and inflation is 1%, real interst rates are at 4%. However, if prices fall by 2% real interest rates rise to 7% (5% -(-2%) = 7%)
  • A rise in debt burdens and deterrent to borrowing. Deflation will lead to an increase in debt burdens for households. Many debts are fixed such as mortgages. This means repayments dont decrease as prices fall leading to higher prices of the debt
Causes of deflation:

  • As seen on the diagram, a sudden increase in supply shifts the Aggregate Supply (AS) curve to AS1. The increase in supply leads to a lower price from P to P1 causing deflation as firms cut their prices to increase sales.
  • Prices go further down as consumers delay spending thinking that the prices will go further down and firms decrease investments an they have less confidence in the economy. 
  • Firms decreasing production leads to them lowering the wage rates. This decreases the consumption even further, lowering the AD curve even more.
  • Less demand from consumers mean that firms lower prices to compete with each other to increase sales. This creates a downward deflationary spiral which is extremely hard to get out of.

Monday, September 4, 2017

The Basic Economic Problem 

Here, we have focused very much on advanced economic concepts but haven't really looked at what economics aims to achieve in our society. Today we will look at what is known as the "basic economic problem". 

What is the Basic Economic Problem?
This question founds the core concepts of economics. There are infinite wants in our society, however resources are scarce. 

Limited resources can be of two different types:
  1. Some things, like machines, can only be used for one purpose, hence are limited in use. 
  2. Some things have finite quantity, so cannot be supplied to everyone who demands. Eg Oil.
Since resources are limited, sacrifices have to be made. Deciding between two different economic possibilities is known as making a choice.
Opportunity cost is the benefit lost from the next best alternative after making the choice.

The three questions to solve the basic economic problem:
  1. What to produce?
  2. How to produce
  3. For whom to produce
By answering these questions, economies can make decisions which will lead to answer the economic problem.

Here is a diagram illustrating the basic economic problem:


Sunday, August 27, 2017


Price Elasticity of Supply (PES)

What is Price elasticity of supply?

    • Price elasticity of supply (PES) is a measure of the responsiveness of quantity supplied to a change in price. 
    • The following equation is used to calculate the PES: 

PES = %change in quantity supplied/%change in price.

What value ranges of PES:
    • PES = 0: Perfectly inelastic, any changes in price do not change the quantity supplied.
    • PES = 1: Unit elastic, percentage changes in price result in a proportionally equal percentage change in the quantity supplied.
    • PES = ∞: Perfectly elastic, a change in price results in an infinitely large change in the quantity supplied.
    • 0 < PES < 1: Inelastic supply, a change in price results in a proportionally smaller change in quantity supplied.
    • PES > 1: Elastic supply, a change in price results in a proportionally larger change in quantity supplied. 
    • NOTES:
      • All the values of PES are positive (unlike PED).
      • Values where PES = 0 or ∞ are completely theoretical and can't exist in real world.


Graphs for the above cases:
Factors affecting PES:
    •  The availability of resources (resource inputs)
    • Mobility of the factors of production
    • Time required for the production process
    • Current production levels and production capacity
    • Durability and the ease of storage


Friday, August 4, 2017

Back to basics part 4 : YED & XED

What is income elasticity of demand (YED) ? 
  • YED is a measure of how much the demand for a product changes when there is a change in the consumer's income
The value range of YED:
  • YED (+) = normal good
  • YED (-) = inferior good
  • 0 < YED > 1 = income inelastic - change in income results in a more than proportionate change in quantity demanded
  • YED > 1 = income elastic - change in income results in a less than proportionate changed in quantity demanded
YED can be illustrated on a diagram called the 'Engel Curve' :


What is cross elasticity of demand (XED) ?
  • XED is a measure of how much demand for a product changes when there is a change in price of another product
The value range of XED:
  • XED (+) = products are substitutes
  • XED (-) = products are complements