Monday, March 12, 2018

Global problems

Globalization has many benefits but is also creating significant global problems.

Short run issues:

  • recessions caused by financial crash or banking crisis 
  • Many global shocks = short term 
  • Other short run occurrences might have long run impacts eg. oil shocks 1970s

Long run issues:

  • global poverty
  • Inequality in economic development
  • depletion of non-renewable resources
  • environmental damage and global warming

Globalization increases the inter-connectivity and interdependence of nations. This leads to long run benefits in areas such as economic growth and employment. However, globalization also creates challenges as well as risks.

Types of shock:

  • Permanent shocks eg. oil shocks - permanently changes markets
  • Temporary shocks eg. terrorist attackspolicy induced shocks eg. inflationary shocks due to rapid increases in the money supply
  • asymmetric shocks - effect one areas more than others
  • symmetric shocks - effect all areas equally
  • demand side shocks - sudden changed in aggregate demand eg. due to huge decrease in consumer confidence
  • supply side shocks - created to increasing costs
  • financial shocks eg. break down of large credit bank
Brexit as an example of a global shock:
  • Brexit will probably just have a short term effect.
  • it will have benefits, but also negative impacts on the global economy
  • the extent to which it will effect the global economy is still unknown and will depend on the negotiations between nations
  • the long term effect of Brexit is still unpredictable


Poverty:
Poverty can be defined in two distinct ways:

1. Absolute Poverty


There are no simple definitions of this as there is a lot of disagreement on the definition of this word. This is a difficult to do.

According to economicsonline.co.uk - The simplest definition of being poor is ‘…being unable to subsist…that is, being unable to eat, drink, have shelter and clothing. A common monetary measure of absolute poverty is ‘..receiving less than $1 a day…’’. (In 2008, the World Bank revised this figure to $1.25 a day, and then again to $1.90 a day in 2015.)

2. Relative Poverty


According to economicsonline.co.uk - It can be argued that poverty can be investigated in a relative way – what is poor in Germany is not the same as what is poor in Bangladesh.
Definitions of relative poverty differ, but the definition of the UK government is typical for developed countries – stating ‘..less than 60% of median income..’.
If we look at international poverty, then, Asia has the highest numbers of poor people due to its large population.
Sub-Saharan Africa has the highest level of poverty, at over 60%.

Human poverty index:

focuses on 3 areas to measure poverty:
  • knowledge 
  • living standards
  • longevity


HPI 1 measured poverty in developing countries
HPI 2 measure poverty in developed countries

HPI – 1.
  1. longevity - probability of not living beyond age 40
  2. knowledge - checked using adult literacy rate
  3. living standard - looked at availability of clean water and whether children are underweight

HPI-2

  1. Longevity probability of not living beyond age of 60
  2. knowledge - checked how many adults do not have sufficient literacy abilities
  3. living standards - how many people live under poverty line 


Development Economics

Economic development are the efforts that seek to improve the economic well-being and quality of life for a community by creating and/or retaining jobs and supporting or growing incomes and the tax base.
There are several indicators which attempt to measure the development of a nation, these are:

The Human Development Index (HDI)

HDI measures the development of a country in 3 areas:
  • health - measured by life expectancy
  • education - measured by adult literacy and number of years children are enrolled at school
  • income per capita
The figures of HDI range from 0 to 1.  0 indicated no development. 1 indicated complete development:
  • 0 – 0.49 = low development
  • 0.5 – 0.69 = medium development 
  • 0.7 to 0.79 = high development 
  • more than 0.8 = very high development 
The HDI is a very useful means of comparing the level of development of countries. GDP per capita alone is clearly too narrow an indicator of economic development and fails to indicate other aspects of development, such as enrolment in school and longevity.

Life expectancy

A variety of factors may contribute to differences in life expectancy, including:
  • The stability of food supplies
  • War
  • The incidence of disease and natural disasters

Adult literacy

The percentage of those aged 15 and above who are able to read and write a simple statement on their everyday life.

GDP per capita

GDP per capita is the commonest indicator of material standards of living, and hence is included in the index of development. GDP per capita It is found by measuring Gross Domestic Product in a year, and dividing it by the population.

Monday, November 27, 2017

International Economics Part 3.1 - Free trade and protectionism

Free Trade - Free trade is a policy followed by some international markets in which countries' governments do not restrict imports from, or exports to, other countries. (i.e. no trade barriers)

Protectionism -  Protection is the attempt to limit imports or promote exports by putting up barriers to trade. Despite the arguments in favor of free trade and increasing trade openness, protectionism is still widely practiced. Here are a few reasons why:

  1. Protecting Infant Industry
  2. Protecting domestic workforce
  3. Anti-dumping measure
  4. To increase government revenue and improve current account deficit

1) Protecting Infant industry: Barriers to trade are used to protect sunrise industries, also known as infant industries, such as those involving new technologies. This gives new firms the chance to develop, grow, and become globally competitive. Protection of domestic industries may allow they to develop a comparative advantage. For example, domestic firms may expand when protected from competition and benefit from economies of scale. As firms grow they may invest in real and human capital and develop new capabilities and skills. Once these skills and capabilities are developed there is less need for trade protection, and barriers may be eventually removed.


2) Protecting an industry may, in the short run, protect jobs, though in the long run it is unlikely that jobs can be protected indefinitely. If the unemployment occurs at large industries, it could lead to very high unemployment rates. However, since the protected industries will be in decline in the long run, protectionism will just prolong this process.


Friday, November 24, 2017

International Economics Part 2 - The World Trade Organization

The world trade organization (WTO), is an organization that sets the rules for global trading and resolves dispute between its members.

All WTO members are required to grant "most favored nation" status to one another, meaning that trade allowances granted by one country to another must be granted to all other members of the WTO.

The WTO attempts to promote free trade, which is a very difficult task, with varying success.
It aims to increase international trade by providing a place for negotiations and by attempting to lower trade barriers. The main functions of the WTO include:


  1. be a forum for trade negotiations
  2. handle trade disputes among its members
  3. administer WTO agreements
  4. providing technical assistance and trading for developing countries
  5. coorporate with other national organizations
  6. monitor national trade policies
Trade liberalization clearly brings many economic and political benefits, but many argue that the WTO has had limited success in certain areas. The main criticisms are:

  1. Failure to confront ethical issues
  2. Failure to confront environmental pollution
  3. Favors the powerful
  4. Low number of agreements
  5. Takes too long to process and settle dispute etc.

Thursday, November 9, 2017

International Economics Part 1 - Reasons to trade?

This series will focus on international economics. Today we will discuss the positive implications of international trade. Lets go baby!!!

1. Greater Choice - Eating fruits and vegetables off-season is a prime example of this. People not only have an access to the domestically produced goods and services, but also products from a number of different countries.

2. Lower prices - International trade gives consumers the opportunity to purchase goods and sevices at a cheaper price as they are able to buy their demanded goods and services from other countries. Producers also gain from international trade, since they can purchase raw materials and other goods from other countries at a cheaper rate. The reason why this is possible is because some countries have more access to natural resources, have better technologies or different quality of labour forces. This means that more raw materials and goods are available, which can be sold at a lower price.

3. Economies of scale - when firms operate on an international market as well as on the domestic one, they are gaining size and therefore will increase the demand. As firms get bigger they can exploit economies of sclae, which will reduce their average costs.

4. Differences in resources - Some countries have different resources than others. When a resource is not available, but a firm needs it to produce a certain product, they can import the resource from different countries. Without international trade this would not be possible and countries with limited amount of resources would not be able to develop.

5. More competition - Because of international trade, domestic producers compete with foreign firms. This results in more efficiency and a reduction in prices. Therefore, consumers will have more options and more qualitative products to choose from.

6. Better allocation of resources - If firms can compete freely without government intervention then countries that are best at producing certain goods and services will produce them. These goods and services will be produced at the lowest cost and the efficiency will be maximized.  Theoretically, if this happens in every country in the world, resources will be allocated most efficiently.


Friday, October 27, 2017

Inequality

One of the biggest problems in todays world is the widening poverty gap between developed and less developed countries.

One of the main economics objectives is to achieve equity, which means fairness or evenness. It is difficult to define and measure. Hence, it is seen as a normative concept. Many economist relate equity to how fairly income and opportunity are distributed between different groups in a society.

Inequality of opportunity:

This occurs when people cannot access employment or institutions. These people cannot benefit from living as much as others in a market economy. 
Example: some children cannot access education, which leats to lower income in the future and lower living standards.

Inequality of outcome:

This happens when some people gain more than others from a transaction. 

Measure of inequality:

Inequlity can be measured by analyzing income distribution. Income distribution can be visualized by looking at a Lorenz curve.


The Lorenz curve shows % of income earned by a given % of population. Perfect income distribution would occur when each % of the population would get the same % of income. For example, Where 75% of the population get 75% of the national income. On the diagram above, income is not equally distributed. 75% of the population only gain 35% of the national income.

Gini coefficient:

This is a mathematical tool, which is used to compare income distributions between different countries. The range is from 0 to 1. The closer the coefficient is to 1 the greater the inequality


Thursday, October 5, 2017

Balance of Payments: Introduction

Balance of payments shows the countries transactions with the rest of the world. The inflows and outflows of this are catagorized into different sections:
  1. Current account(CA) balance of payments
  2. Fiscal account (capital) balance of payments

Balance of payment problems

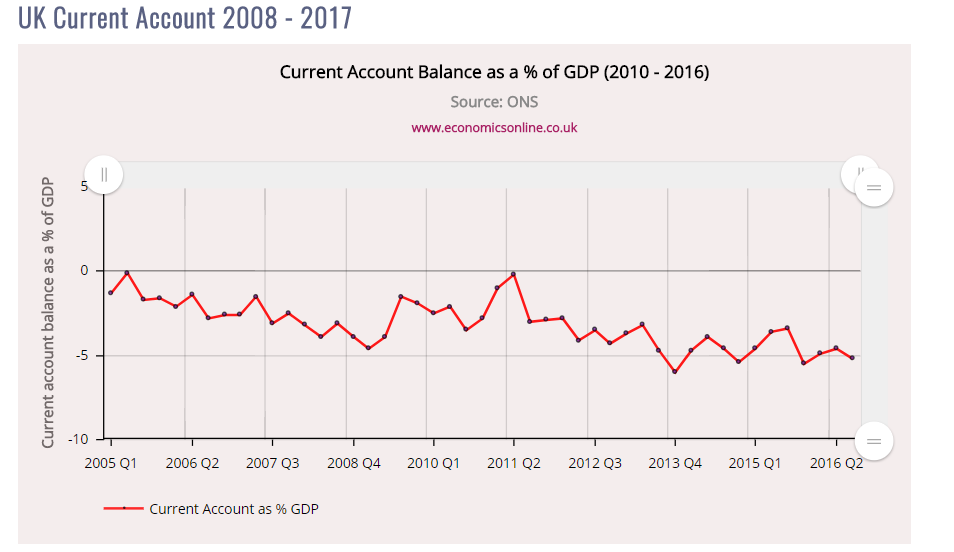
Trading goods and services forms the largest part of countries current account. It also includes primary (refering to international payments of factors of production i.e. investment income and compensation to employees) and secondary income(refering to transfer payments flowing between countries i.e pension payments and oversea aids) flows. 

Example of UK's current account balance:


The trade balance is a part of the current account and refers to trades in goods and services between the country and the world. UK's trade balance example:


The current account defecit can be a problem when:

  1. There are no compensating inflows of investment income or inward capital account flows.
  2. The economy has a poor record of repaying debt.
  3. It is a persistent deficit that does not self-correct over time.
  4. The deficit forms a large share of GDP.
  5. The central bank has low reserves.


Saturday, September 16, 2017

 Deflation
Deflation is defined as the reduction in the general price level of an economy. 

Problems resulting from deflation;
  • Consumers might delay consumption. This is because consumers will try to save their money until prices drop even further so they can purchase their desired good more cheaply. This will have a negative impact on aggregate demand, incomes and output
  • Recession can occur due to reductions in consumer and business confidence. Consumers and businesses will rather save than spend. A recession caused by deflation is difficult to solve, since there will be a deflationary spiral in the economy.
  • Increase in real interest rates, since nominal interest rates cannot fall below 0. If nominal interest rates are 5% and inflation is 1%, real interst rates are at 4%. However, if prices fall by 2% real interest rates rise to 7% (5% -(-2%) = 7%)
  • A rise in debt burdens and deterrent to borrowing. Deflation will lead to an increase in debt burdens for households. Many debts are fixed such as mortgages. This means repayments dont decrease as prices fall leading to higher prices of the debt
Causes of deflation:

  • As seen on the diagram, a sudden increase in supply shifts the Aggregate Supply (AS) curve to AS1. The increase in supply leads to a lower price from P to P1 causing deflation as firms cut their prices to increase sales.
  • Prices go further down as consumers delay spending thinking that the prices will go further down and firms decrease investments an they have less confidence in the economy. 
  • Firms decreasing production leads to them lowering the wage rates. This decreases the consumption even further, lowering the AD curve even more.
  • Less demand from consumers mean that firms lower prices to compete with each other to increase sales. This creates a downward deflationary spiral which is extremely hard to get out of.

Monday, September 4, 2017

The Basic Economic Problem 

Here, we have focused very much on advanced economic concepts but haven't really looked at what economics aims to achieve in our society. Today we will look at what is known as the "basic economic problem". 

What is the Basic Economic Problem?
This question founds the core concepts of economics. There are infinite wants in our society, however resources are scarce. 

Limited resources can be of two different types:
  1. Some things, like machines, can only be used for one purpose, hence are limited in use. 
  2. Some things have finite quantity, so cannot be supplied to everyone who demands. Eg Oil.
Since resources are limited, sacrifices have to be made. Deciding between two different economic possibilities is known as making a choice.
Opportunity cost is the benefit lost from the next best alternative after making the choice.

The three questions to solve the basic economic problem:
  1. What to produce?
  2. How to produce
  3. For whom to produce
By answering these questions, economies can make decisions which will lead to answer the economic problem.

Here is a diagram illustrating the basic economic problem:


Sunday, August 27, 2017


Price Elasticity of Supply (PES)

What is Price elasticity of supply?

    • Price elasticity of supply (PES) is a measure of the responsiveness of quantity supplied to a change in price. 
    • The following equation is used to calculate the PES: 

PES = %change in quantity supplied/%change in price.

What value ranges of PES:
    • PES = 0: Perfectly inelastic, any changes in price do not change the quantity supplied.
    • PES = 1: Unit elastic, percentage changes in price result in a proportionally equal percentage change in the quantity supplied.
    • PES = ∞: Perfectly elastic, a change in price results in an infinitely large change in the quantity supplied.
    • 0 < PES < 1: Inelastic supply, a change in price results in a proportionally smaller change in quantity supplied.
    • PES > 1: Elastic supply, a change in price results in a proportionally larger change in quantity supplied. 
    • NOTES:
      • All the values of PES are positive (unlike PED).
      • Values where PES = 0 or ∞ are completely theoretical and can't exist in real world.


Graphs for the above cases:
Factors affecting PES:
    •  The availability of resources (resource inputs)
    • Mobility of the factors of production
    • Time required for the production process
    • Current production levels and production capacity
    • Durability and the ease of storage


Friday, August 4, 2017

Back to basics part 4 : YED & XED

What is income elasticity of demand (YED) ? 
  • YED is a measure of how much the demand for a product changes when there is a change in the consumer's income
The value range of YED:
  • YED (+) = normal good
  • YED (-) = inferior good
  • 0 < YED > 1 = income inelastic - change in income results in a more than proportionate change in quantity demanded
  • YED > 1 = income elastic - change in income results in a less than proportionate changed in quantity demanded
YED can be illustrated on a diagram called the 'Engel Curve' :


What is cross elasticity of demand (XED) ?
  • XED is a measure of how much demand for a product changes when there is a change in price of another product
The value range of XED:
  • XED (+) = products are substitutes
  • XED (-) = products are complements

Friday, July 28, 2017

Back to basics Part 3 - Price Elasticity of demand

What is Price elasticity of demand?
  • The price elasticity of demand is the measurement of the responsiveness of demand to a change in price.
  • The formula for price elasticity of demand (PED) is - 

  • The value range of PED:
    • PED = 1: Unit elastic, Change in price results in a proportionally equal change in quantity demanded.
    • PED = 0: Perfectly inelastic, change in price results in no change in quantity demanded.
    • PED = : Perfectly elastic, a change in price results in a infinitely large change in demand.
    • 0 < PED < 1: Inelastic demand: A change in price results in a proportionally small change in demand.
    • PED > 1: Elastic demand: A change in price results in a proportionally larger change in demand.
    • IMPORTANT NOTE: 
      • You may have noticed that all values are negative, but assume that for the above PED equations, the value of PED is positive absolute value.
      • The case where PED = 0 or ∞, are completely theoretical and cannot exist in the real world. 
  • Graphs for the above cases: 


  • Factors affecting PED - 
    • The number and closeness of substitutes
    • The necessity of the product and how widely the product is defined
    • Time period considered

Friday, July 21, 2017

Back to Basics Part 2: Supply

What is Supply?

  • Supply is the willingness and ability of producers to produce a quantity of goods and services at a given price at a given time period. 
  • The law of supply states that, as price increases, the quantity supplied of the product will increase, ceteris paribus. 
  • An example could be the market of frozen pizzas. The following graph demonstrates the rule above.


  • This happens because at higher prices there will be more potential profits to be made and so the producer will increase output. 

  • Factors affecting supply other than price - 
    • The costs of factors of production
    • The state of technology
    • Expectations
    • The price of other products which the producer could produce instead of the existing product.
    • Amount of Government intervention
  • A change in any of these factors (other than price) will shift the supply curve, for example:

Friday, July 14, 2017

Back to Basics Part 1 : DEMAND
What is demand? 
  • Demand is the quantity of goods or services that consumers are willing and able to purchace at given prices over a given time period.
  • The law of demand states that, as the price of a good falls, the quantity demanded of therpoduct will usually increase, ceteris paribus. (Ceteris paribus is an assumption  that means "all other things being equal")
  • An example is the soft drink market. The following graph demonstrates the rule above. 
  • As you can see, when the price falls, the demand increases. This is for 2 reasons-
    • Income effect- When the price of a product falls, the people will have an increase in their real income, which reflects the amount that their income will buy. 
    • Substitution effect- When the price of the product falls, it will be relatively more attractive to people than other goods.
  • Factors affecting demand other than price- 
    • Income
    • Price of other products
    • Taste and preferances
    • Advertisement
    • Population and Age structure
    • Other factors such as government policies, etfc.
  • A change in any of these factors (other than price), will shift the demand curve, for example:

Monday, July 10, 2017

Supply Side Policy
Supply Side Policies are government attempts to increase productivity and shift Aggregate Supply (AS) to the right.

How do supply side policies work?
Supply side policies aim to increase the long run aggregate supply. This can be done by increasing the quality or quantity of factors of production. Here are a few ways of achieving this - 

1) Increase in training & education - Education is under-provided by the market as it is a merit good. Therefore, governments increase the quality and quantity of training and education by either providing the education themselves or by subsidising companies.

2) Reduction in direct taxes (eg. income tax) - Lower taxes may provide workers with an incentive to work even harder.

3) Improvements in Infrastructure - Improving trasnport and roads will reduce costs of firms which means they invest that in increasing the quality and quantity of their supply.

4) Privatisation - It is argued that private sector firms are more efficient as they have different goals, than the state sector counter parts, which forces them to be more productive. 

5) Reducing the power of Trade Unions - This increases the efficiency of firms and reduce unemployment because trade unions force higher wages. 

6) Deregulation - This invlolves reducing legal barriers to entry (eg. laws) which increase competition as more firms are able to enter the market. Additionally, Monopoly power can be reduced by restricting anti-competitive behaviors.

Advantages of Supply side policices.

1) Lower Unemployment
2) Higher Economic Growth
3) Reduction in the rate of Inflation.

Disadvantages of Inflation.

1) Involves extremely high costs
2) Takes a lot of time to implement.
3) Depends on the initial level of economic activity. 


Friday, June 16, 2017

Monetary Policies

Monetary policy are demand-side policies, which target the aggregate demand of an economy by influencing interest rates and controlling the money supply.  
The central bank is an independant organization, which is responsible for adjusting the base interest rate of an economy. Their primary objective is to hit the target inflation rate (usually 2%).

How does interest policy work?
  • Expansionary: (decrease in IR)
    • Consumption increases - less incentive to save due to lower returns & demand for mortgages increases due to lower interest payments
    • Investment increases - more incentive to invest into capital due to lower cost of borrowing
  • Contractionary: (increase in IR) 
    • Consumption decreases - more incentive to save due to higher returns & demand for mortgages decreases due to higher interest payments
    • Investment decreases - less incentive to invest into capital due to higher cost of borrowing
Advantages of using monetary policies:
  1. affect consumption & investment ( both large components of AD)
  2. Not affected by politics
  3. faster than other demand-side policies
  4. can affect AS as well as AD
  5. easily reversible
Disadvantages :
1. Money supply policy can get out of control leading to stronger/uncontrollable inflation
2. Time lag - need long time to implement (usually 18 months)
3. useful for demand-pull inflation, but ineffective when controlling cost-push inflation
4. Interest rates cannot fall below 0
5. Reaction may not be as expected

Depends on:
  • initial level of economic activity
  • level of consumer/business confidence - if confidence low than even if interest rates decreases businesses/consumer will not necessarily spend more/save less
  • size of multiplyer 
  • level of change in interest rates - huge change=huge affect/small change=small affect
  • Other factors expansionary monetary policy impaired by contractionary fiscal policy
Real life example :
USA central bank plans to increase interest rates from 0.75% to 1% 

Saturday, May 6, 2017

National Income
National Income the total amount of money earned within a country. National income is the total value a country’s final output of all new goods and services produced in one year.

National income accounts The published national income accounts for the UK, called the ‘Blue Book’, measure all the economic activities that ‘add value’ to the economy.


  • Adding value - National output, income and expenditure, are generated when there is an exchange involving a transaction. However, for an individual economic transaction to be included in national income it must involve the purchase of newly produced goods or services. It must create an addition to the value of the scarce resources.
  • Transactions which do not add value are called transfers, and include second-hand sales, gifts and welfare transfers paid by the government, such as disability allowance and state pensions.
  • The Creation of National Income - goods are produced in a number of 'stages', where raw materials are converted by firms at one stage, then sold to firms at the next stage. Value is added at each, intermediate, stage, and, at the final stage, the product is given a retail selling price. The retail price reflects the value added in terms of all the resources used in all the previous stages of production.
  • Final output - only the value of the final stage, the retail price, is included, and not the value added in all the intermediate stages - the costs of production, plus profits.  In short, national income is the value of all the final output of goods and services produced in one year.
Example - 
For example, consider the production of a motor car which has a retail price of £25,000. This price includes £21,000 for all the costs of production (£6,000 for components, £10,000 for assembly and £5,000 for marketing) plus £4,000 for profit. To avoid double-counting, the national income accounts only record the value of the final stage, which in this case is the selling price of £25,000.
Bildunterschrift hinzufügen
When goods are bought second-hand, the transaction does not add new value and will not be included in national output. If second-hand goods are included, double-counting will occur, and this would falsely inflate the value of national income.

For example, if the car in question is sold in two year’s time for £15,000 it would provide the owner with money, but the sale will not add to national income. If it were included in national income, it would make the value of the car £35,000  - the initial £25,000 plus the second hand value of £15,000. This is clearly not the case, so any future second-hand sales are not included when valuing national income. Such second-hand transactions are called transfers.


Friday, March 17, 2017

                        Aggregate Demand and Supply
What is Agregate Demand?
Aggregate demand (AD) is the total demand by domestic and foreign  households and firms for an economy's scarce resources, less the demand by domestic households and firms for resources from abroad.

Aggregate demand consists of the amount households plan to spend on goods (C), plus planned spending on capital investment, (I) + government spending, (G) + exports (X) minus imports (M) from abroad. The standard equation is: 
AD = C + I + G + (X – M)

The aggregate demand curve:


The AD curve shows the relationship between AD and the price level. It is assumed that the AD curve will slope down from left to right. This is because all the components of AD, except imports, are inversely related to the price level.

What is aggregate supply:
Aggregate supply (AS) is defined as the total amount of goods and services (real output) produced and supplied by an economy’s firms over a period of time. It includes the supply of a number of types of goods and services including private consumer goods, capital goods, public and merit goods and goods for overseas markets.

Coponents of AS :
  • Consumer goods 
  • Capital goods
  • Public and merit goods
  • Traded goods
The aggregate supply curve:


Friday, March 10, 2017

Perfect Competition

What is perfect competition?
A perfectly competitive market is a hypothetical market where competition is at its greatest possible level. It is argued that this type of market gives the best results for consumers and for society overall.

What are the assumptions of this model?
  1. The market consists of many firms which are relatively small as compared to the overall market size. 
  2. All products which all the firms in an industry produce are considered to be homogenous. 
  3. There is Perfect Knowledge for all stakeholders in the market.
  4. There are no Barriers to Entry or Exit.
  5. Firms are Profit maximizing.
  6. Firms are Price Takers due to the Perfect Knowledge available. 
Explanation:
The single firm takes its price from the industry and is referred to as a price taker. The industry is made up of all firms in the industry and the market price is where demand is equal to supply. Each single firm must charge this price. Any other price will lead to consequences which will have a negative impact on the business.
Under perfect competition, firms can make abnormal profits or losses.
However, in the long run firms are attracted into the industry if businesses are making abnormal profits. This is due to the availability perfect knowledge and the lack of barriers to entry. The effect of this entry into the industry is to shift the supply curve to the right, which decreases price until there are no abnormal profits anymore. If firms are making losses, they will leave the market as there are no exit barriers, and this will shift the supply curve to the left, which increases price and enables those left in the market with just normal profits.

Advantages:
  1. No monopoly power
  2. no information failure
  3. allocatively and productively efficient
  4. more choice
  5. lower prices (as compared to other market structures)
Disadvantages:
  1. No abnormal profits possible - no dynamic efficiency.
  2. less choice to consumers - due to less product differentiation.
  3. benefits of economies of scale are lost.
  4. no profits for research and development.
Examples:
 - Agricultural markets.
In some cases, there are several farmers selling identical products to the market, and many buyers. At the market, it is easy to compare prices. Therefore, agricultural markets often get close to perfect competition.

 - Financial markets
eg. Currency markets.

Sources: http://www.economicsonline.co.uk/